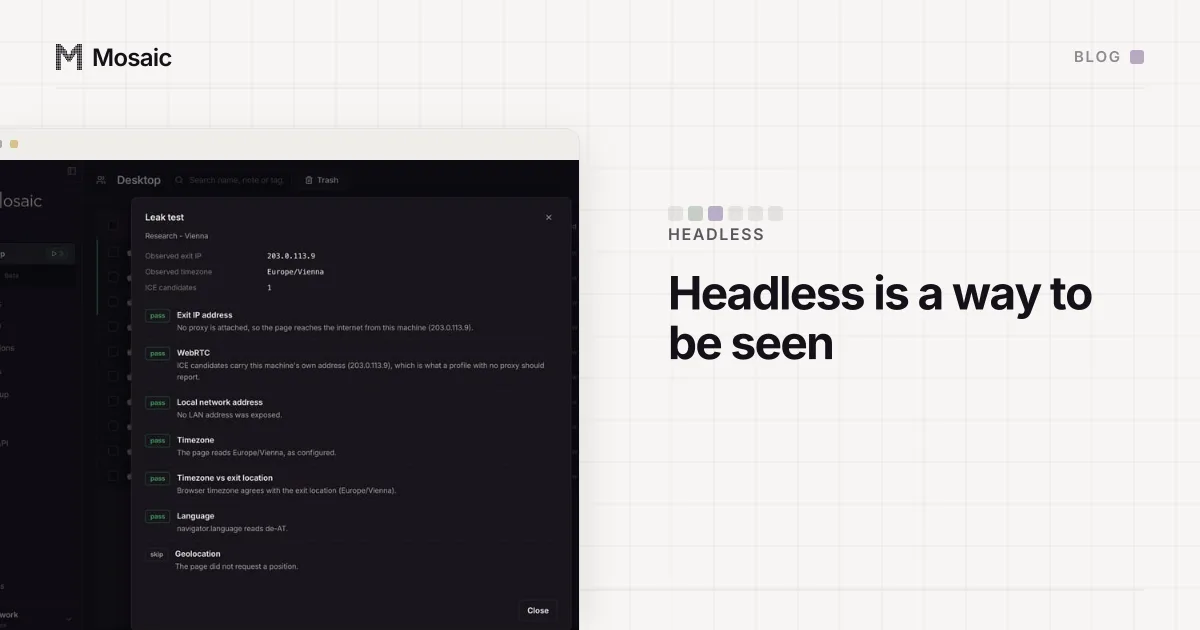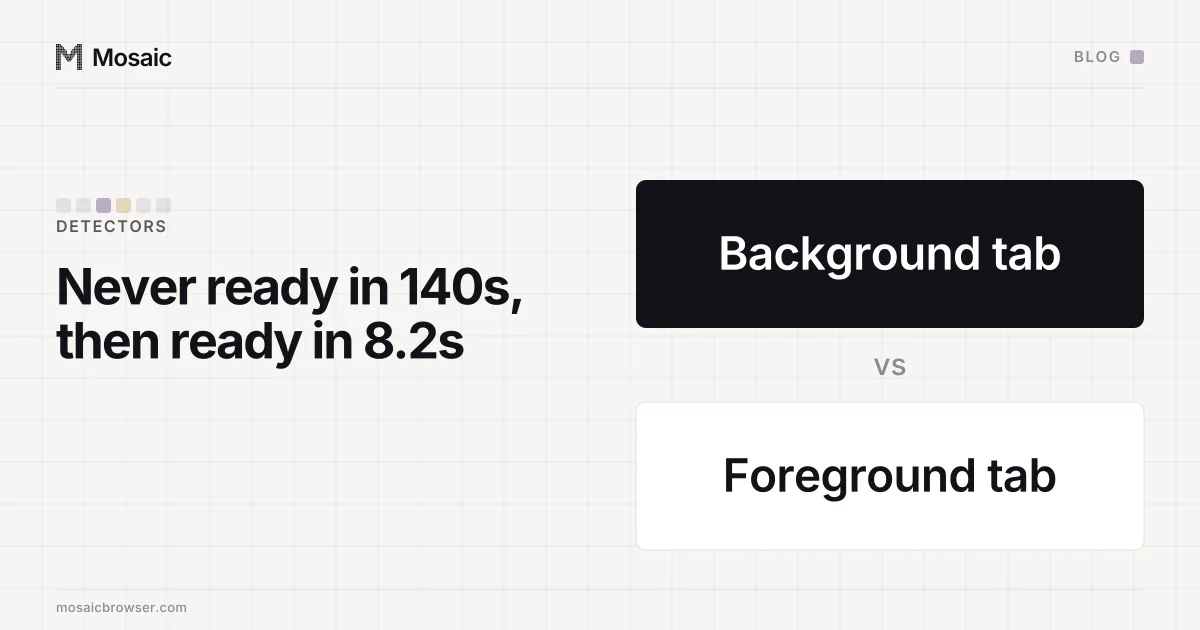
Chromium does not run requestAnimationFrame callbacks in a background tab, and background tab throttling holds that tab's timers to about one call a second. We knew that as a fact about browsers. We did not know it was a fact about our own test harness, and two detectors sat at unread because of it, one of them for weeks. One call to Page.bringToFront before each navigation made both of them answer within seconds.
Two rows that would not read
Our detection suite drives a profile through a catalogue of public detectors and reads each one's verdict off the page. Most rows read cleanly. Two did not: deviceandbrowserinfo and fingerprint-scan kept coming back unread, which in our catalogue means the page loaded and no verdict ever rendered.
The runner printed its own explanation every time: the raw detection JSON had not rendered, it arrives a few seconds after load, raise settleMs if this persists. It persisted. We raised the budget from 20 seconds to 45, then to 140. Nothing changed. A wait that does not help at 45 seconds is unlikely to start helping at 140, and in hindsight that was the moment to stop raising it.
Every configuration, ruled out one at a time
The obvious suspect was the browser. So we replayed the launcher's exact command line, all 68 flags, and changed one thing per row:
stock Chrome for Testing 153            isBot: false in 5s
our engine, bare                        isBot: false in 5s
our engine, the launcher's 68 flags     isBot: false in 10s
each flag group dropped in turn         isBot: false
the launcher's three CDP overrides      isBot: false
a launcher-started profile, any tab     isBot: false in 5s
this runner, four consecutive runs      right URL, complete, no verdict at 45s
Every browser configuration answered, quickly, with a clean result. Only the runner failed, and it failed the same way four times running. So it was never the engine and never the profile. The difference lived in the harness.
Every profile is drawn from one real computer, not from separate listsIn Mosaic: Machines that exist. GPU, screen, CPU and fonts from one real device. Free holds 3 profiles. Pro is $49 a month for any number.
Mosaic is a desktop app
Email yourself the link and open it on your computer.
How it works: Machines that exist
Asking the page what it had fetched
readyState: complete says the document and its subresources finished loading. It says nothing about whether a script on the page went on to do its job. These detectors deliver their verdict over the network, so the useful question was whether the collector had ever sent anything.
performance.getEntriesByType('resource') lists every request the page made. It needs no DevTools domain, so reading it cannot itself be the thing a detector notices. On a passing run and a failing one, the lists looked like this:
passing   …/fingerprint_bot_test, 4x api/network-probe, api/ingest-fingerprint
failing   none of them
The failing page had loaded and then done nothing. Its collector had never finished, so it never posted its fingerprint, so there was never a verdict to render. Raising the timeout had been waiting for a request that was never going to be made.
The tab was hidden
The cause was one line of Chromium behaviour and one line of our own code. Our runner creates the tab it tests in, then creates a blank scratch tab after it. The newer tab becomes the active one. So every page in the catalogue had been loaded into a background tab, with animation frames paused and timers throttled.
Most detectors did not care. Their collectors finish without waiting on a frame, or finish slowly enough to get there anyway. The two that broke were the two that depend on the slowest collector: deviceandbrowserinfo and fingerprint-scan both load fingerprint-scan.com/v1/fp.js, and that script is the slowest collector in the catalogue. In a throttled tab it never finished.
We added Page.bringToFront before each navigation:
fingerprint-scan       never ready in 140s   ->  ready in 8.2s, pass
deviceandbrowserinfo   never ready in 45s    ->  ready in 4.4s, pass
We chose the call over reordering the two tab creations. Reordering would have worked, and it would have been undone by the next change that opened a tab later. Page.bringToFront says what the test needs at the line that needs it.
How requestAnimationFrame background tab throttling catches automation
If you drive Chrome yourself, through Puppeteer, Playwright or raw CDP, the same trap is easy to walk into. Opening a second page, a popup, or a devtools target can push the page you care about into the background without anything telling you.
Three checks catch it:
- Read
document.visibilityStatein the page you are testing.hiddenmeans animation frames are not running. - Watch for a
visibilitychangeevent during the run. A page that goes hidden half-way through a test has measured two different browsers. - Before navigating a tab you need to be live, send
Page.bringToFrontto it.
None of this is specific to fingerprinting. Any page that animates, polls, or spreads work across frames behaves differently in a background tab, and a test that reads such a page from the background is measuring Chromium's power saving, not the site.
What we kept from it
A timeout that does not help is a question about the page, not the clock. When raising the budget changes nothing, the thing you are waiting for is probably not coming.
Ask what the page fetched. The resource list separated "slow" from "never started" in one call, after four rounds of configuration bisection had separated nothing. It is part of the suite's diagnostic dump now.
And a harness that measures a browser is part of the browser it measures. The runner was not measuring a profile; it was measuring a tab Chromium had deliberately slowed down, and reporting that as the site failing to answer. Stock Chrome for Testing answering in five seconds was the same kind of control as the one in the control is Google's own build, and this time it pointed at the harness rather than the engine. The full catalogue the suite reads is in our list of 49 detectors, and how we run it unattended is in automating fingerprint tests. Another detector that looked broken and was not, for a different reason, is the fingerprint.com demo that would not load.